Technically speaking, the Stochastic Relative Strength Index (RSI) is an indicator that was developed by Tushar Chande and Stanley Kroll.
It is more commonly referred to by its acronym, StochRSI. The Relative Strength Index (RSI) and the Stochastic Oscillator (SO) are the two components that are combined to create this relatively well-known indicator.
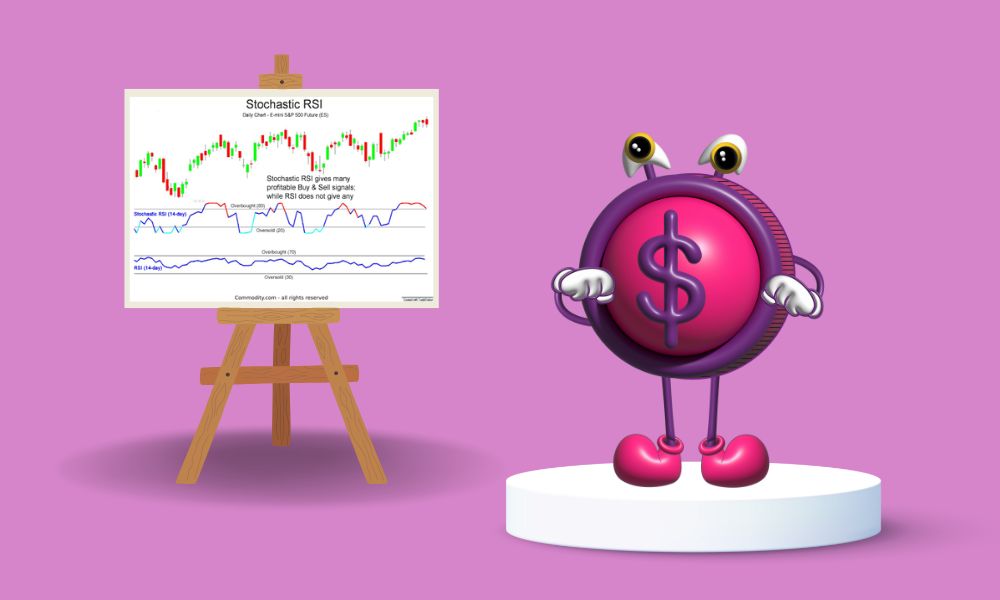
When developing a trading strategy, one of the most common applications of the stochastic relative strength index (StochRSI) is to search for readings that fall within the overbought and oversold ranges.
Readings below 0.2 are considered to reflect oversold conditions, whereas readings above 0.8 reflect overbought market conditions.
The StochRSI ranges from 0 to 1, with 0 being the centre point. Readings that indicate an oversold condition during a larger uptrend are interpreted as bullish signals, whereas readings that indicate an overbought condition during a larger downtrend are interpreted as bearish.
However, extreme volatility in the stochastic relative strength index calls for extreme caution. After an overbought or oversold reading, trade entry should not be made until the subsequent price action confirms the move.
As an illustration, readings that indicate that an asset is overbought should not be interpreted as an entry signal but rather as a warning of a possible move.
In order to provide evidence that the bearish trend is still active, the StochRSI indicator needs to move back below the 0.5 centerline.
In order for a larger bullish trend to materialise, it is necessary for the stochastic RSI to rise above 0.5 after oversold readings.
Readings of the stochastic RSI that remain in the oversold or overbought territory for an extended period of time may indicate that the trend is about to change.
Suppose that a certain security has been in a pronounced downward trend for a number of weeks and that its RSI readings have ranged between 18 and 60.
The RSI displays a reading of 56 for the current session. The StochRSI calculation reveals a different picture than the traditional interpretation of this RSI reading, which would not normally be considered an actionable indicator.
This session's StochRSI reading comes in at (56 - 18) / (60 - 18), which equals 0.9. Following the completion of the bullish correction, the price is likely to continue falling because of the significant overbought signal that occurred within the larger downward trend.
 Top THREE Award-Winning Brokers in 2022 Top THREE Award-Winning Brokers in 2022 LiteFinance |IC Markets|Exness |
As soon as the StochRSI moves back below 0.5, enter a short position using market or limit orders, depending on which strategy appeals to you more.
A useful place to put a stop-loss order is at the point where the bullish retrace made its highest high. The bulls have already made one attempt to push the price beyond this point, but they were unsuccessful. A move that takes the price beyond this point could signal the end of the bearish trend.
Because the stochastic relative strength index (StochRSI) produces such a large number of positive and negative signals, it is prudent to look for corroborating evidence of trend continuation from other indicators.
StochRSI signals are strengthened when they are accompanied by persistently strong volume and candlestick patterns, such as the falling three methods.


